Worst stock market days in history
Stock shock continues: World reacts to tariffs
The stock shock is continuing as Dow, S&P 500 and Nasdaq are under intense pressure for a second day as global investors sell equities in response to President Trump's sweeping tariffs against the majority of U.S. trading partners, including China who is retaliating. LiveNOW's Austin Westfall discusses the changes with Jerry Parker, CEO of Chesapeake Capital.
President Donald Trump’s tariff hikes announced last week continue to roil global trade and swing stock markets.
Last week’s plunge in the U.S. market is among the steepest of the last decade, but the day the stock market took the biggest hit still dates back to the ‘80s.
Here’s a look back at some of the worst days in stock market history:
Worst stock market days in history
The graph above shows last week’s stock market drop alongside some of the worst collective daily declines of the stock market between the three major stock exchanges: the Dow Jones Industrial Average, the S&P 500 and the Nasdaq Composite.
For context, last week’s decline is included.
Dig deeper:
Dow Jones Industrial Average worst day: Oct. 19, 1987, dropped 22.61%
S&P 500 worst day: Oct. 19, 1987, dropped 20.47%
Nasdaq worst day: March 3, 2020, dropped 12.32%
Worst stock market daily point drops
Stock market points vs. percentage drops
A percentage change in the stock market reflects the increase or decrease in value, while a point increase or decrease can be more useful in context of showing the overall health of the market.
Read more about some of the worst days in stock market history below.
RELATED: Stocks tumble as Trump’s tariffs roil global markets

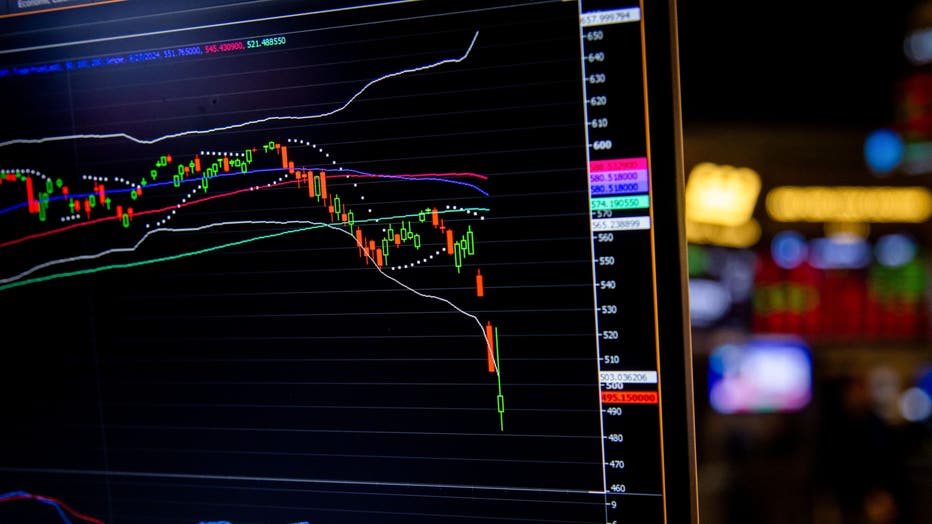
A monitor displays a S&P 500 ETF SPY chart on the floor of the New York Stock Exchange (NYSE) in New York, US, on Monday, April 7, 2025. Photographer: Michael Nagle/Bloomberg via Getty Images
Black Monday - 1987
The backstory:
On Oct. 19, 1987, the stock market crashed on what came to be known as "Black Monday." Several economic and structural flaws led to the crash, according to The Federal Reserve’s history.
By the numbers:
- Dow Jones Industrial Average: Dropped 22.6%, 508 points
- S&P 500: Dropped 20.4%, 58 points
- Nasdaq: Dropped 11.3%, 46 points
March 16, 2020 stock market
The backstory:
March 16, 2020, was the worst day for the stock market since the 1987 crash, driven by concerns about the COVID-19 pandemic and its impact on the global economy.
A few days earlier, the Trump Administration declared a nationwide emergency and additional travel bans, and state governments began to implement shutdowns.
By the numbers:
- Dow Jones Industrial Average: Dropped 12.9%, 2,997 points
- S&P 500: Dropped 12%, 325 points
- Nasdaq: Dropped 12.3%, 970 points
Wall Street crash of 1929
The backstory:
On Oct. 29, 1929, ‘Black Tuesday’ descended on the New York Stock Exchange. Prices collapsed amid panicked selling and thousands of investors were wiped out as America’s Great Depression began.
By the numbers:
Several dates in late October and early November in 1929 drove down the S&P 500 and the Dow. The Nasdaq Composite did not exist yet. The two markets took the biggest hit on Oct. 28, 1929:
- Dow Jones Industrial Average: Dropped 12.8%, 38 points
- S&P 500: Dropped 12.3%, 3 points
The Source: Information on the stock market prices of the Dow Jones, S&P 500 and Nasdaq were taken from various searchable public records. Background information about the stock market crash of 1987 and the COVID pandemic timeline was taken from websites of The Fed and the CDC, respectively. This story was reported from Detroit.

